Observability built around incidents, not dashboards.
Detect anomalies, understand service dependencies, and resolve incidents faster with topology-aware intelligence.
Trusted Enterprise-Grade Architecture
Traditional monitoring creates noise. You need signals.
Dashboards and static alerts generate alert fatigue. When an incident occurs, engineers are forced to manually investigate relationships across disjointed tools to find the root cause.
Alert Fatigue
Hundreds of alerts firing for a single underlying issue, burying the actual root cause in noise.
Manual Investigation
Engineers spend hours hunting through logs, traces, and metrics across disconnected observability silos.
High MTTR
Without topological context, resolving complex distributed system failures takes far too long.
Actionable incidents.
Not alerts.
Lumetry correlates your telemetry, topology, and anomalies into actionable incidents. We connect the dots so your on-call engineers don't have to.
- Automatic correlation of metrics, logs, and traces to underlying infrastructure.
- Topology-aware grouping eliminates redundant alerts.
- Identify the blast radius of any degradation in seconds.
Payment Gateway Latency Spike
Everything you need. Nothing you don't.
A comprehensive observability suite designed for modern infrastructure.
Topology Mapping
Automatically map dependencies across your entire infrastructure.
Anomaly Detection
Detect statistical anomalies in real-time before they impact users.
Incident Correlation
Group alerts by topological proximity to reduce noise.
OpenTelemetry Support
Native ingestion for traces, metrics, and logs using OTLP.
Prometheus Support
Drop-in replacement for Prometheus Remote Write.
Automatic Discovery
Agents automatically discover running services without configuration.
Collector Architecture
Horizontally scalable collectors process telemetry at the edge.
Role-Based Access
Securely control access to observability data across your teams.
Enterprise-Grade Architecture
Built to handle petabytes of telemetry data securely and efficiently.
Agents
Edge Collectors
Lumetry Platform
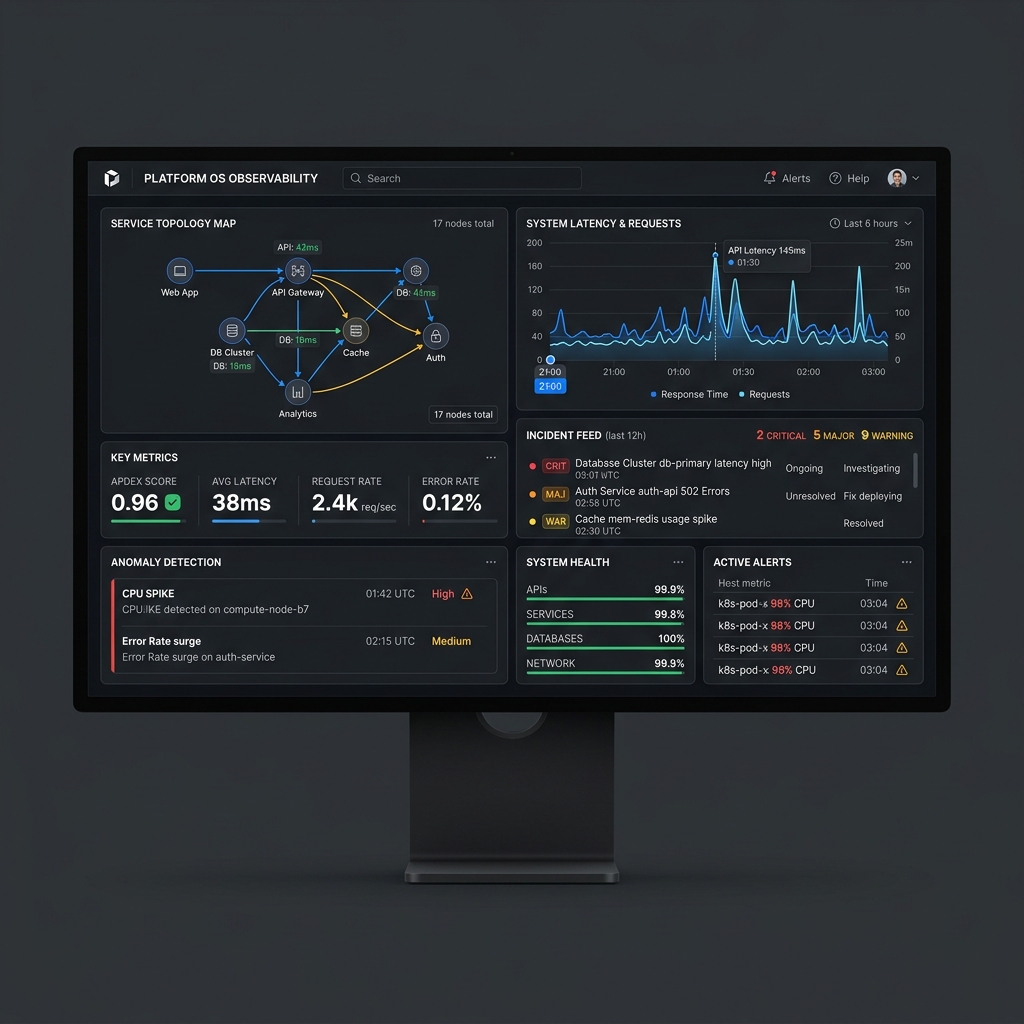
Unprecedented Visibility
Enterprise observability dashboards designed for clarity and speed.
Simple, predictable pricing
Start for free, scale to petabytes. No hidden fees or surprise overages.
Growth
For scaling startups and mid-market.
- 1TB Data Ingestion
- Unlimited Users
- 30-day Retention
- Advanced Anomaly Detection
Enterprise
For large-scale, mission-critical ops.
- Unlimited Data Ingestion
- Custom Retention (up to 3 years)
- Dedicated Technical Account Manager
- 24/7 Phone Support
Stop chasing alerts.
Start resolving incidents.
Join the most forward-thinking engineering teams using Lumetry to bring sanity back to on-call.